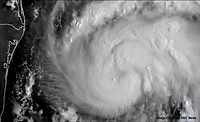
CoreLogic Analysis Shows an Estimated 8.5 Million Properties in Florida at Significant Risk of Potential Wind Damage from Hurricane Irma

Table 2: Total Properties in the High/Moderate Risk Level
| CoreLogic Data | Extreme (Affected by a Category 1-5 Storm) | Very High (Affected by a Category 2-5 Storm) | High Affected by a Category 3-5 Storm) | Moderate (Affected by a Category 4-5 Storm) | Low (Affected by a Category 5 Storm) | Total Properties at Risk |
|---|---|---|---|---|---|---|
| Florida | 455,505 | 888,654 | 864,333 | 702,407 | 583,836 | 3,494,735 |
| Cape Coral-Fort Myers | 57,855 | 189,137 | 128,073 | 57,300 | 52,099 | 484,464 |
| Crestview-Fort Walton Beach-Destin | 4,611 | 5,599 | 8,318 | 8,611 | 8,323 | 35,462 |
| Deltona-Daytona Beach-Ormond Beach | 1,760 | 16,634 | 38,481 | 43,412 | 15,000 | 115,287 |
| Gainesville | 0 | 43 | 465 | 634 | 515 | 1,657 |
| Jacksonville | 10,859 | 36,149 | 63,442 | 42,709 | 60,139 | 213,298 |
| Key West | 16,917 | 23,050 | 54,360 | |||
| Lakeland-Winter Haven | 0 | 0 | 0 | 0 | 0 | 0 |
| Miami-Fort Lauderdale-Pompano Beach | 82,344 | 149,120 | 209,417 | 227,882 | 226,057 | 894,820 |
| Naples-Marco Island | 24,774 | 102,232 | 76,667 | 7,414 | 1,645 | 212,732 |
| North Port-Bradenton-Sarasota | 28,536 | 59,662 | 86,255 | 103,249 | 54,534 | 332,236 |
| Ocala | 2 | 1 | 3 | 5 | 23 | 34 |
| Orlando-Kissimmee-Sanford | 0 | 0 | 0 | 0 | 0 | 0 |
| Palm Bay-Melbourne-Titusville | 11,565 | 25,354 | 22,570 | 16,430 | 15,778 | 91,697 |
| Palm Coast | 1,248 | 9,957 | 5,414 | 4,322 | 3,844 | 24,785 |
| Panama City-Lynn Haven-Panama City Beach | 465 | 5,056 | 14,448 | 14,427 | 16,312 | 50,708 |
| Pensacola-Ferry Pass-Brent | 2,079 | 9,445 | 13,259 | 9,770 | 10,784 | 45,337 |
| Port St. Lucie | 12,720 | 8,621 | 8,484 | 7,957 | 19,997 | 57,779 |
| Punta Gorda | 64,020 | 83,391 | 32,878 | 23,009 | 1,006 | 204,304 |
| Sebastian-Vero Beach | 6,016 | 7,646 | 5,896 | 6,598 | 12,129 | 38,285 |
| Tallahassee | 2,427 | 3,008 | 7,399 | 7,166 | 2,811 | 22,811 |
| Tampa-St. Petersburg-Clearwater | 105,551 | 125,591 | 114,308 | 103,776 | 70,231 | 523,457 |
Source: CoreLogic 2017
Looking for a reprint of this article?
From high-res PDFs to custom plaques, order your copy today!


