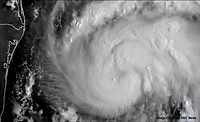
IRVINE, Calif., September 8, 2017—CoreLogic® (NYSE: CLGX), a leading global property information, analytics and data-enabled solutions provider, today released data analysis which shows that an estimated 8,456,455 residential and commercial properties in Florida are at either “Extreme,” “Very High” or “High” risk of wind damage from Hurricane Irma. CoreLogic storm surge analysis shows that an estimated 3,494,735 residential and commercial properties in Florida are at risk of hurricane-driven storm surge damage. Neither analysis includes potential damage from inland flooding.
Table 1 shows the estimated number of residential and commercial properties at risk of wind damage for both Florida and select Core Based Statistical Areas (CBSAs). Table 2 shows the estimated number of residential and commercial properties at risk of storm surge damage from Hurricane Irma for the state and the same CBSAs.
Storm surge occurs when water is pushed toward the shore through the force of powerful winds associated with cyclonic storms. High winds and low pressure created by a storm causes water to accumulate at its center, and as it moves across the ocean, the strong winds inside the hurricane act as a plow, causing water to pile up along the front of the storm.
Table 1: Estimated Number of Residential and Commercial Properties at Risk of Wind Damage from Hurricane Irma
Data in Tables 1 and 2 should not be combined to calculate totals as these are independent CoreLogic peril analyses and property duplication can occur.
| CoreLogic Data | Extreme | Very High | High | Moderate | Low |
|---|---|---|---|---|---|
| Florida | 2,658,005 | 3,393,312 | 2,405,138 | 854,238 | 11,586 |
| CBSA | |||||
| Cape Coral-Fort Myers | 85,402 | 36,039 | 401,004 | 0 | 0 |
| Crestview-Fort Walton Beach-Destin | 3 | 68,527 | 0 | 29,294 | 0 |
|
Deltona-Daytona Beach-Ormond Beach |
7 | 88,419 | 171,942 | 1 | 0 |
| Gainesville | 2 | 1 | 9,028 | 96,015 | 0 |
| Jacksonville | 15 | 277 | 187,777 | 437,763 | 3,828 |
| Key West | 26,117 | 29,406 | 0 | 0 | 0 |
| Lakeland-Winter Haven | 7 | 320,052 | 41 | 19 | 0 |
| Miami-Fort Lauderdale-Pompano Beach | 2,202,056 | 32 | 316 | 0 | 0 |
| Naples-Marco Island | 7,069 | 211,011 | 98 | 0 | 0 |
| North Port-Bradenton-Sarasota | 53 | 31,102 | 411,534 | 0 | 0 |
| Ocala | 21 | 136,124 | 24,041 | 704 | 0 |
| Orlando-Kissimmee-Sanford | 3 | 448,287 | 459,060 | 4 | 0 |
| Palm Bay-Melbourne-Titusville | 6,472 | 139,893 | 136,933 | 0 | 0 |
| Palm Coast | 0 | 62,521 | 9,070 | 0 | 0 |
| Panama City-Lynn Haven-Panama City Beach | 0 | 111,056 | 0 | 0 | 0 |
| Pensacola-Ferry Pass-Brent | 10,077 | 203,261 | 3,381 | 8,544 | 0 |
| Port St. Lucie | 234,597 | 30 | 57 | 0 | 0 |
| Punta Gorda | 0 | 1 | 205,616 | 0 | 0 |
| Sebastian-Vero Beach | 86,012 | 3,643 | 0 | 0 | 0 |
| Tallahassee | 3 | 52,943 | 0 | 0 | 109,726 |
| Tampa-St. Petersburg-Clearwater | 1 | 1,148,059 | 79,401 | 0 | 0 |
Source: CoreLogic 2017


